Plotting
tplot function
All plotting is called through the “tplot()” function. If you’d like to customize how you plots are displayed, it is assume that you have set them up prior to calling this function.
-
pytplot.tplot(name, var_label=None, slice=False, combine_axes=True, nb=False, save_file=None, gui=False, qt=False, bokeh=False, save_png=None, display=True, testing=False, extra_functions=[], extra_function_args=[], vert_spacing=None, pos_2d=False, pos_3d=False, exec_qt=True, window_name='Plot', interactive=False)[source]¶ This is the function used to display the tplot variables stored in memory. The default output is to show the plots stacked on top of one another inside of a qt window
Parameters: - name – str / list List of tplot variables that will be plotted
- var_label – str, optional The name of the tplot variable you would like as a second x axis.
- slice – bool, optional If True, a secondary interactive plot will be generated next to spectrogram plots. Mousing over the spectrogram will display a slice of data from that time on the interactive chart.
- combine_axes – bool, optional If True, the axes are combined so that they all display the same x range. This also enables scrolling/zooming/panning on one plot to affect all of the other plots simultaneously.
- nb – bool, optional If True, the plot will be displayed inside of a current Jupyter notebook session.
- save_file – str, optional A full file name and path. If this option is set, the plot will be automatically saved to the file name provided in an HTML format. The plots can then be opened and viewed on any browser without any requirements.
- bokeh – bool, optional If True, plots data using bokeh Else (bokeh=False or omitted), plots data using PyQtGraph
- extra_functions – func, optional This is an extra function that gets called just prior to the data being plotted. This is useful if you’d like to build your own Qt display that reacts to the mouse movement. Built in displays can be found in the AncillaryPlots folder.
- extra_function_args – list of tuples, optional These are the arguments to give your extra_functions
- vert_spacing – int Thes distance in pixels you’d like the plots to be
- gui – bool, optional If True, then this function will output the 2 HTML components of the generated plots as string variables. This is useful if you are embedded the plots in your own GUI. For more information, see http://bokeh.pydata.org/en/latest/docs/user_guide/embed.html
- qt – bool, optional If True, then this function will display the plot inside of the Qt window. From this window, you can choose to export the plots as either an HTML file, or as a PNG.
- save_png – str, optional A full file name and path. If this option is set, the plot will be automatically saved to the file name provided in a PNG format.
- display – bool, optional If True, then this function will display the plotted tplot variables. Necessary to make this optional so we can avoid it in a headless server environment.
- testing – bool, optional If True, doesn’t run the ‘(hasattr(sys, ‘ps1’))’ line that makes plots interactive - i.e., avoiding issues
Returns: None
Examples
>>> #Plot a single line in bokeh
>>> import pytplot
>>> x_data = [2,3,4,5,6]
>>> y_data = [1,2,3,4,5]
>>> pytplot.store_data("Variable1", data={'x':x_data, 'y':y_data})
>>> pytplot.tplot("Variable1",bokeh=True)
>>> #Display two plots
>>> x_data = [1,2,3,4,5]
>>> y_data = [[1,5],[2,4],[3,3],[4,2],[5,1]]
>>> pytplot.store_data("Variable2", data={'x':x_data, 'y':y_data})
>>> pytplot.tplot(["Variable1", "Variable2"])
>>> #Display 2 plots, using Variable1 as another x axis
>>> x_data = [1,2,3]
>>> y_data = [ [1,2,3] , [4,5,6], [7,8,9] ]
>>> v_data = [1,2,3]
>>> pytplot.store_data("Variable3", data={'x':x_data, 'y':y_data, 'v':v_data})
>>> pytplot.options("Variable3", 'spec', 1)
>>> pytplot.tplot(["Variable2", "Variable3"], var_label='Variable1')
>>> #Plot all 3 tplot variables, sending the output to an HTML file
>>> pytplot.tplot(["Variable1", "Variable2", "Variable3"], save_file='C:/temp/pytplot_example.html')
>>> #Plot all 3 tplot variables, sending the HTML output to a pair of strings
>>> div, component = pytplot.tplot(["Variable1", "Variable2", "Variable3"], gui=True)
Oveplotting
To combine two or more variables in the same plot, you need to create a new variable like so:
pytplot.store_data("new_variable", data=["variable1_to_overplot", "variable2_to_overplot"])
Then when you plot this new variable, it will be a combination of the two variables given in “data”.
Note
Each variable should still retain the plot options you set for it, but I am still working out the kinks.
Extra X axes
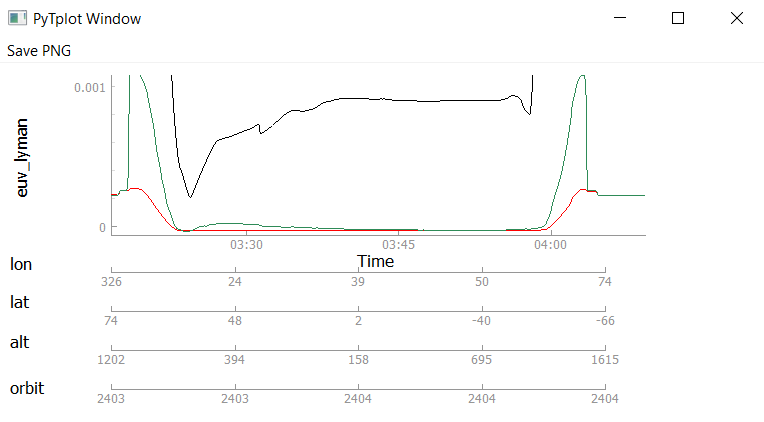
A commonly used feature of tplot is adding extra x axes (in addition to time), on the bottom of the plot.
To do so in pytplot, specify which tplot variable(s) you’d like to to be included on the axis by passing them to the “var_label” option in tplot:
pytplot.tplot("variable1", var_label = ["variable2", "variable3"])
Note
Unfortunately, in the Bokeh plots currently the extra x axes must be linearly increasing in order to display properly. Hopefully we can determine a way to map variables onto the axes at some point in the future.
A common use case would be orbit numbers or spacecraft position. Here is an example of multiple x axes below: