Introduction
What is pytplot?
Pytplot is an effort by the Laboratory for Atmospheric and Space Physics to replicate the functionality IDL tplot library. It is a tool for manipulating, analyzing, and plotting time series data. Primarily, it is focused on handling lines and spectrograms from satellite data. It can plot using either Qt via pytqtgraph, or using HTML files via Bokeh.
What does it do?
Because the tplot library evolved over several decades with new features being added depending on what scientists needed, there is a variety of things it does:
- Reads in data from a variety of sources (including netCDF and CDF file readers)
- Stores data in a common format, alongside all of its metadata and plot options.
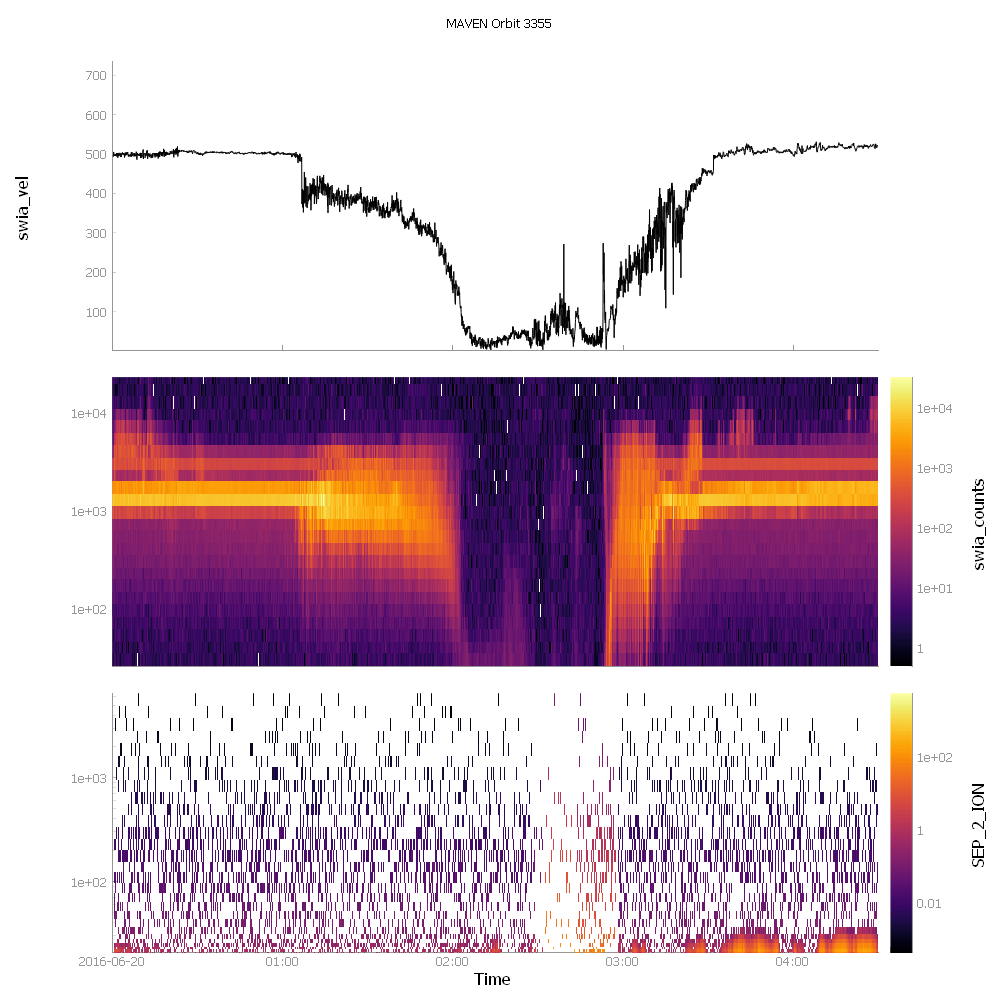
- Plots the data in a stacked time series plot with time as the common axis.
- Easily add new axes
- Provides a list of simple commands to modify the plots (line styles, colors, etc), or overplot two different variables
- Provides time series data analysis/manipulation routines
- Provides tools to enable mouse interactions with other python routines
Pyqtgraph Sample
Interactive Bokeh Sample
Version History
1.7.22
1.7.22 Changes: * Fixed some issues with the data_quants giving inconsistant dictionary keys throughout the code * Fixed a bug where the var_label axis would not extend all the way to line up with the other plots * Added “var_label_ticks” as a variable option to alter the number of ticks if the variable is displayed as a secondary x axis * Changed default behavior of plots to not zoom in on the y axis with the mouse wheel * Added the “y_axis_zoom” global option to toggle on/off the above change
1.7.21 Changes: * Brought the yaxis labels closer to the axis ticks * Fixed a bug with saving black background plots * Added new tplot_options: yaxis_width and axis_tick_num
1.7.20 Changes: * Increased the number of ticks that are always shown on the yaxis by default * get_data now returns a named tuple * new lines are allowed within axis labels by using a backslash character
1.7.19 Changes: * Added some support for non-record varying variables * Set default CDF string encoding to ASCII * Fixed a handful of bugs within the IDL restore
1.7.16 Changes: * Added keyword for get_ignore_data in cdf_to_tplot
1.7.15 Changes: * Added support in tplot_restore for higher dimensional variables
1.7.14 Changes: * Added visible right and upper axes so that the plots are always boxed in like in IDL tplot
1.7.10 Changes: * Added a metadata dictionary from CDF files to the tplot variables * Added the replace_data function
1.7.6 Changes: * Added the ability to call pytplot.tplot_options(“axis_font_size”, x) to alter the axis font label size for all plots. * Modifed 1D plot to change default color to white when the black background in enabled.
1.7.5 Changes: * Altered the functionality of the tplot_ascii tool to use the xarrays functions
1.7.4 Changes: * Reverting a change from 1.7.1 back
1.7.3 Changes: *fixing tplot math add routine to actually add
1.7.2 Changes: * Fixing some issues with the import order of various graphic tools. Should be easier to import where graphics are disabled.
1.7.1 Changes: * Fixing bugs where the crosshairs give inaccurate values * Adding a “tplot_copy” method to copy tplot variables * Adding an option to specify which axis to plot on the spectrogram
1.7.0 Changes: * Updating to pyqtgraph 0.11.0
1.6.9 Changes: * Fixed a small bug where the spectrogram plot type is set without having spec bins data.
1.6.8 Changes: * Fixing a small issue with the add_across rotuine, the attributes from the input and output should not be copied
1.6.7 Changes: * Fixed bug introduced in previous version
1.6.5 Changes * Changes issues with split_vec giving errors when “v” values are given to line plots. Thanks to Nick Hatzigeorgiu for finding / solving the bug
1.6.4 Changes * Fixed an issue where sts_to_tplot wasn’t merging with previous calls
1.6.1 Changes * Fixed some issues with the cursor movement not displaying correctly * Fixed issues with nan data values in the spec slicing code causing the slices to not display
1.5.6 Changes
- Fixed qtwebengine import to only apply previous fix if the initial import fails
- Set version of pyqt to be <=5.12.1 for now, apparently higher versions can cause issues
1.5.5 Changes:
- Fixed import qtwebengine errors, and a few other small bugs
1.5.3 Changes:
- Bug fix for NaN values in time varying “v” values in spectrogram plots
1.5.2 Changes:
- Fixed an issue with cdf_to_tplot when DEPEND_1/2/3 were string values instead of numbers. They are now ignored if string.
1.5.1 Changes:
- Added ability to read in specific variable names in cdf_to_tplot
1.4.8 Changes:
- The coordinates for 3+ dimensional objects should now be read in correctly.
1.4.7 Changes:
- Added two more ancillary plots, Mars 2D Map and Mars 3D Map
1.4.6 Changes:
- Occasionally logged spec plots would not be properly displayed, this is a hopefully a quick fix for that
1.4.5 Changes:
- Fixing typescript errors with bokeh
1.4.4 Changes:
- Fixing pyqtgraph’s collections.abc imports
1.4.3 Changes:
- Bug fix where ylog could not be unset
1.4.1 Changes:
- Fixed small bug in the spec plots for certain file types
- Added PySPEDAS changes to the cdf_to_tplot routine
1.4.0 Changes:
- Added documentation
- Redid tplot variables as xarrays
- Added many unit tests
- Numerous bug fixes
1.3.3 Changes:
- Added power spectrum calculation routine
1.3.2 Changes:
- Updates to the spectrogram plots and CDF reader
1.3.0 Changes:
- Added interactive plots for spectrograms, documentation coming soon
1.2.11 Changes:
- Commenting out tplot_math stuff
1.2.9 Changes:
- Added a netcdf_to_tplot reader
- Changed date axis to show more relevant times
1.2.8 Changes:
- Adding merge functionality to the cdf_to_tplot routine
1.2.5 Changes:
- Adding tplot_math, with various basic functions to begin data analysis
- Crosshairs now implemented in pyqtgraph
- Timebars work in alt/map plots
1.2.4 Changes:
- Fixed for latest version of Anaconda
1.2.1 Changes:
- Fixed a bug in the pyqtgraph spec plots with time varying bins
1.2.0 Changes:
- Added ability to display an arbitrarily large number of qt plot windows, if done from ipython
1.1.13 Changes:
- Added overplot capabilities to the Qt Plotting routines
1.1.12 Changes:
- Fixed major issue with pip installer
- Added ability to use pytplot without a graphics interface, if building only html files are desired.
1.1.6 Changes:
- Fixed a spot where python warnings were changed to change back after the function was over
1.1.4 Changes:
- Added a qt option to tplot, which will allow users to just open the HTML file in a browser window
1.1.3 Changes:
- Bug fix, pyqtgraph was creating a layout every time which eventually caused a crash
- Still a known error where bokeh will no longer plot more than once
1.1.2 Changes:
- Added support for bokeh 0.12.13
1.1.0 Changes:
- Added the ability to plot directly in the Qt Window with pyqtgraph. This may entirely replace the bokeh plotting routines at some point.
1.0.15 Changes:
- Changing tplot to use QtWebKitWidgets by default, but attempt to use QWebEngineView if not found
1.0.14 Changes:
- Fixed a bug in cdf_to_tplot
1.0.11 Changes:
- Bug fixes in the last couple of revisions
1.0.8 Changes:
- Reverting back QWebEngineView changes from 1.0.6
1.0.7 Changes:
- Should be able to export to HTML properly now.
1.0.6 Changes:
- Qt is getting rid of support for QtWebView. QWebEngineView will replace it, but has great difficulty viewing html greater than 2GB.
- As a temporary solution, a local html file is saved, and then read into QWebEngineView.
1.0.5 Changes:
- Fixed a memory leak
1.0.2 Changes:
- Added cdf_to_tplot routine
- Made a version checker